Answers about any place in Australia.
DataQuoll turns fragmented Australian public data into one view of a location: what has happened there, what is happening now, and the conditions around it. Today: emergency incidents and warnings, disaster declarations, river gauges and industry calendars, with an archive back to 1840.
# What has happened at this location?
$ curl -X POST -H "Authorization: Bearer $DATAQUOLL_KEY" \
    "https://dataquoll.io/api/v1/hazard-history/point" \
    -d '{"lat": -28.8078, "lng": 153.2766}'

# What is happening near it right now?
$ curl -H "Authorization: Bearer $DATAQUOLL_KEY" \
    "https://dataquoll.io/api/v1/incidents?state=nsw&eventType=bushfire"

# What are the river levels around it?
$ curl -H "Authorization: Bearer $DATAQUOLL_KEY" \
    "https://dataquoll.io/api/v1/gauges?state=qld"
# 200 OK application/json
{
"location": { "lgaName": "Lismore", "stateCode": "NSW" },
"declared": {
"distinctCount": 27,
"earliest": "2009-03-30",
"latest": "2025-03-03"
},
"observed": { "archiveTotal": 7, "earliest": "1988-04-07" },
"gauge": { "name": "Lismore (Wilsons River)", "distanceM": 404 }
}Used by teams at














A real answer
Two coordinates in. Everything official, out.
Live output from the production API, not a mockup. The coordinates are a street in Lismore, NSW, and the radius is 1 km. Measured 2026-08-23.
curl -X POST https://dataquoll.io/api/v1/hazard-history/point \
  -H "Authorization: Bearer $DATAQUOLL_KEY" \
  -H "Content-Type: application/json" \
-d '{"lat": -28.8078061, "lng": 153.2766097, "radiusKm": 1}'{
"location": { "lgaName": "Lismore", "stateCode": "NSW" },
"declared": { "distinctCount": 27, "earliest": "2009-03-30" },
"observed": { "archiveTotal": 7, "earliest": "1988-04-07" },
"gauge": { "name": "Lismore (Wilsons River)", "distanceM": 404 },
"coverage": [ "... what the answer does not know" ]
}- 27
- declared disasters since 2009
- 1988
- earliest event recorded at this location
- 404 m
- to the Lismore (Wilsons River) gauge
The same event, published three times
Each of those declarations is issued separately by DisasterAssist, the national recovery funding register and the state spatial service. Counting the rows gives 67. Counting the events gives 27. DataQuoll collapses them on the official reference number and still tells you which authorities recorded each one.
And it tells you what it misses
The case that proves the two lanes are both needed. The February 2022 flood put this street under water, and the observed lane holds no record of it at this precision. It is here through the declared lane, as AGRN 1012. Every response carries its own limits: how precisely each record is located, which records have no date, and the fact that an absent record is not evidence that nothing happened.
Who this is for
Built for developers, insurers, newsrooms and utilities who need this data to be right.

Developers
Ship safety features without maintaining 34 feeds
Every state publishes its own data, in its own format, on its own schedule. We handle all of it so you do not have to. One endpoint, one schema, every jurisdiction.
Good for tracking apps, monitoring tools, smart home, field safety, anything that needs to know what is happening near a location.
See what developers build
The archive
Point in time, not a best guess after the fact
4.8 million archived incidents going back to 1840, each one timestamped as it was reported. Ask what was active on a date and get the answer that was true then, not a reconstruction.
Coverage is continuous from the 1930s, with a sparse tail of older events reaching back to 1840.
How the archive is structured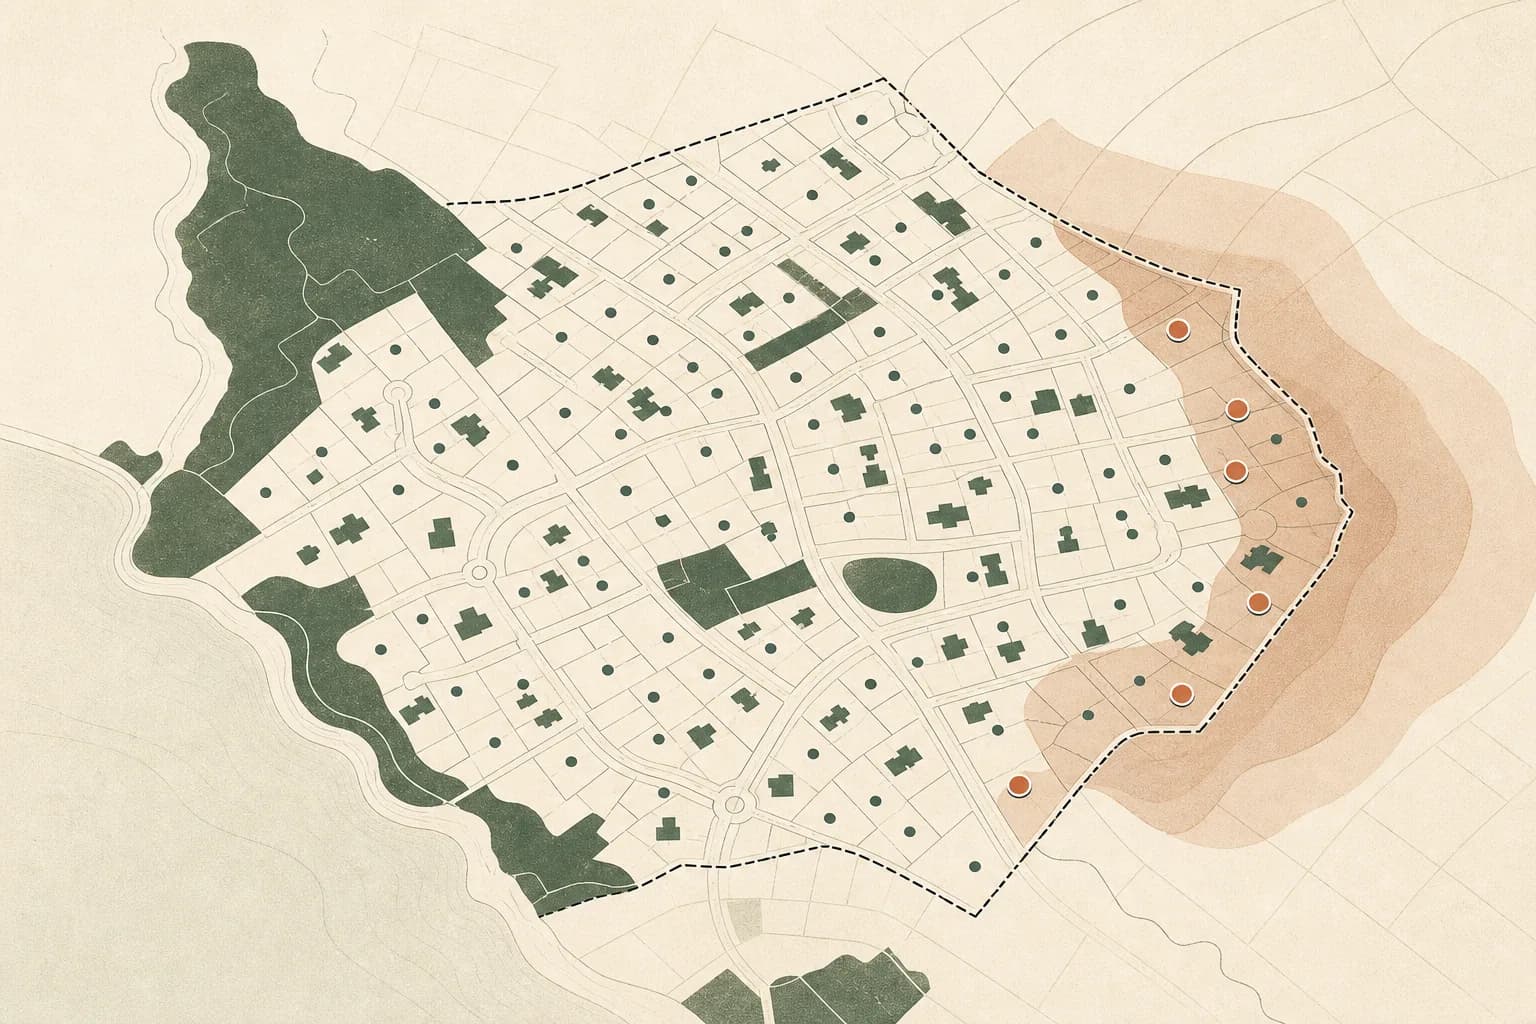
Insurance and risk
See your exposure as it moves
Live peril data across every state, tied to location. Plus a timestamped historical record you can stand behind at claim time.
Insurance and risk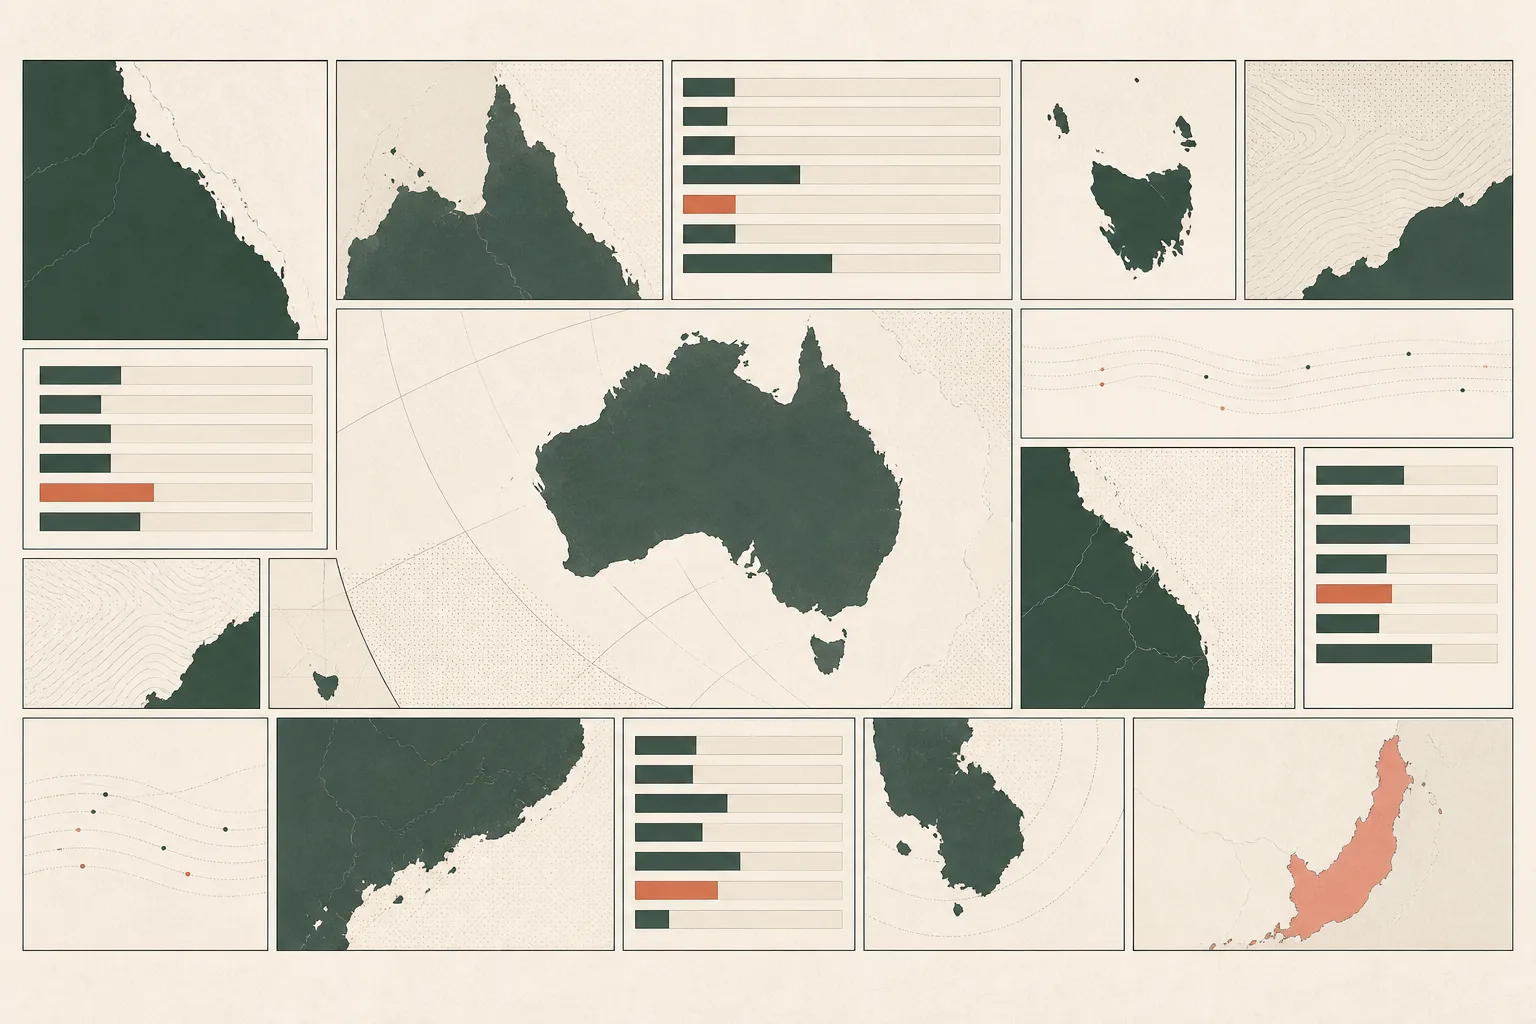
News and media
Power your live incident map from one source
Fires, floods, warnings and road closures nationwide, updating as they break. No scraping 8 different state websites during a bad week.
Newsroom use
Utilities and infrastructure
Know what is happening near your network
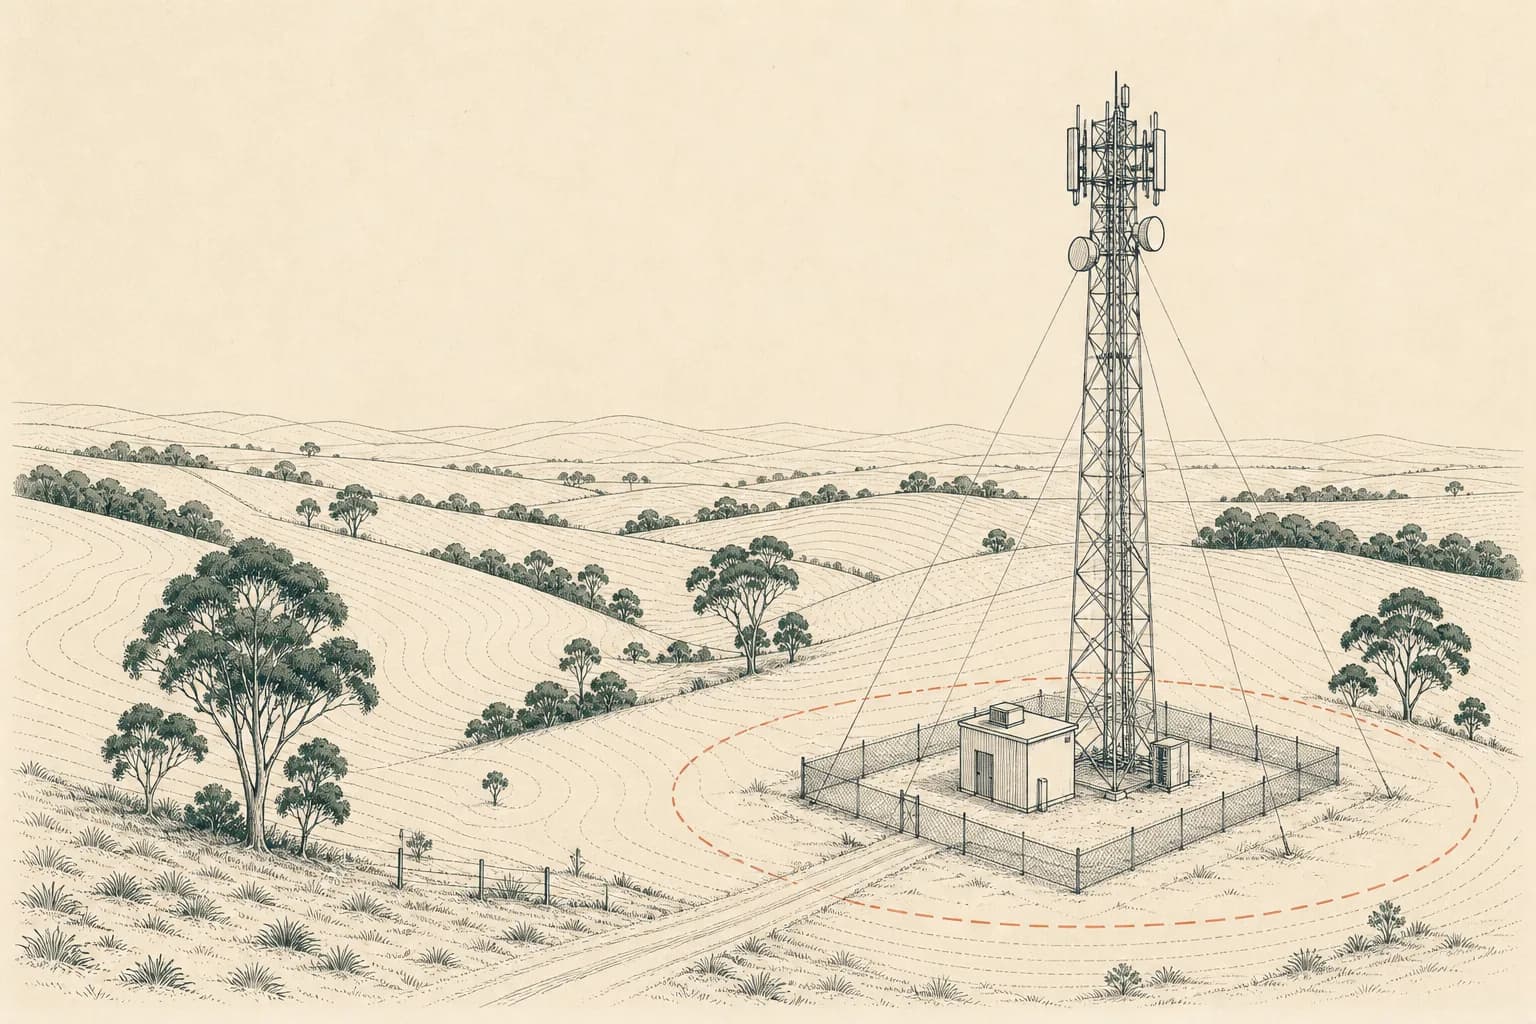
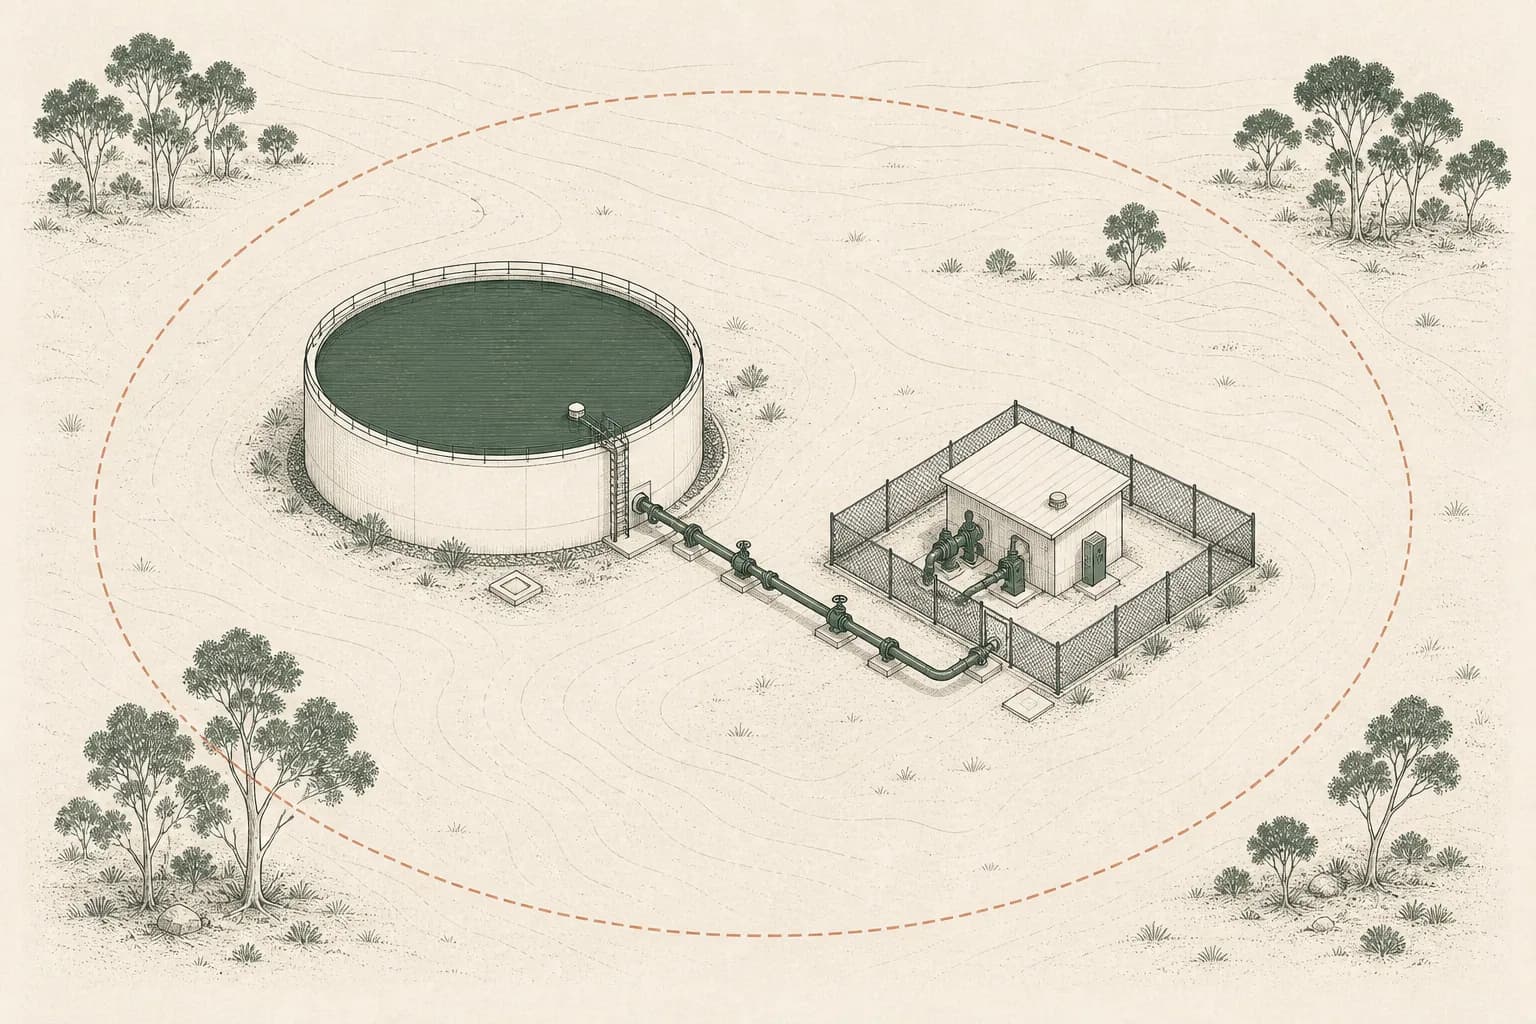
Poles, lines, towers, substations, sites. Feed your asset locations in, get alerts when an incident lands nearby.
Works for anyone with assets in the field.
Utilities and infrastructureThe information already exists. Making it useful is the hard part.
Agencies publish well, for their own operational purposes. The result is that the answer to a simple question about a place is technically available and practically out of reach. Six steps sit between the two, and the last two are the ones almost nobody does.
01
Aggregate
Official sources polled continuously and monitored, so a feed that goes quiet is visible rather than silently absent.
02
Normalise
One schema. The same event described four ways by four agencies becomes one shape a machine can read.
03
Place
Geometry and coordinate systems reconciled, so every record can be asked the question "is this near here".
04
Correlate
Fragmented reports clustered into coherent events, with boundaries and the suburbs they touch.
05
Contextualise
Declarations and river conditions attached, so an event sits inside what else was true at the time.
06
Answer
One view of a location, carrying where every part of it came from and how far to trust it.
What you can ask
Every question below is answerable today, with a key and one request.
- What has happened at this location?
- The observed record plus every declaration covering it, back through the archive.
- What is happening near it right now?
- Live incidents within a radius or a bounding box, filtered server-side.
- Has this place been inside a declared disaster area?
- Declared status by local government area or postcode, counted once per event.
- Which incidents belong to the same event?
- Fragmented reports clustered, with a derived boundary and the suburbs it covers.
- What are the river levels around it?
- Live gauge readings joined to the Bureau flood classifications, with verified datums.
- What did this look like at a moment in the past?
- Point-in-time snapshots reconstructed from the archive rather than guessed after the fact.
One platform, three ways in
The API is how developers reach the data. Intelligence is the answer already assembled. Monitor is the one we are still building, and it is labelled as such.
For developers
DataQuoll API
Available now
Every dataset behind one integration, one schema and one key, instead of a scraper per agency.
- Live incidents, warnings, declarations and river gauges
- One GeoJSON schema with CAP-AU severity, urgency and certainty
- Proximity and bounding-box queries, filtered server-side
- Source attribution travelling with every record
For analysts and risk teams
DataQuoll Intelligence
Available now
The assembled answer rather than the raw record. What has happened at a location, and what was true around it.
- Per-location hazard history across both the observed and declared lanes
- An archive of 4.8 million records, earliest 1840
- Point-in-time snapshots reconstructed from the archive
- Declared-area status by local government area, counted once per event
For teams with places to watch
DataQuoll Monitor
In development
Standing watches on the locations and assets that matter to you, so a public event reaches your systems when it becomes relevant to one of them. Not yet available.
- Mining sites, substations, network and telecommunications assets
- Property portfolios, depots, farms
- Today the API gives you everything needed to build this yourself
Built for integration
Every official source, one contract to write against
One schema, every jurisdiction
New South Wales calls it a category, Queensland calls it a warning level, South Australia publishes neither. Every record arrives in the same shape no matter who issued it.
Attribution travels with the data
Every record carries the agency that issued it, the licence it is published under, and the moment we fetched it. You never have to reconstruct provenance.
- agency
- NSW RFS
- licence
- CC BY 4.0
- fetched
- 16:46:12 +10:00
Retractions are explicit
When an agency pulls an incident, you get a tombstone and a reason. Records do not quietly disappear between polls.
Built to be read by machines
GeoJSON and CAP-AU Atom out of the box, cursor pagination for backfills, and an OpenAPI spec you can generate a typed client from.
const res = await fetch(
  "https://dataquoll.io/api/v1/incidents",
  { headers: { "Authorization": `Bearer ${key}` } }
);

const { features } = await res.json();
// GeoJSON. Also available as CAP-AU Atom.
Disaster declarations
Stop checking declared areas by hand
Telehealth platforms and providers currently answer “is this address in a declared area” by reading government notices and PDFs, one at a time, per patient. It is slow, it is manual, and it is out of date the moment an instrument is revoked. This turns it into a lookup.
- Look it up at the point of care.
- Pass a postcode, an LGA code or a lat/lng and get the current declared status for that area, with the instrument and the dates it covers. One call, in the workflow, instead of a tab open on a government PDF.
- It changes without telling you.
- Declarations are added, extended and withdrawn on the authority’s schedule, not yours. We track the published sources so a status checked this morning is the status that is actually current, not the one from the last time somebody remembered to look.
- Every answer is dated and sourced.
- Each response carries the AGRN, the instrument type and the source it came from, so the status you acted on can be shown later exactly as it stood at the time. The practitioner still records their own reasoning; this is the area fact underneath it.
DataQuoll reports the declaration and funding activation status of an area, as published by government sources. It does not provide medical, billing or legal advice, and it does not determine whether any exemption applies. That decision rests with the treating practitioner, who documents it and their clinical reasoning at the time of service.
At home
Know when something happens near home.
This is already the most common thing people do with DataQuoll. Home Assistant users pull nearby incidents into their own dashboards and automations, and build whatever they want on top.
What people actually build
- A light that changes colour when there is a fire within ten kilometres
- A notification when a nearby river crosses a flood classification
- A dashboard card showing what is active in their own local government area
- A speaker announcement when a warning is raised near the house
The free tier covers this kind of use. DataQuoll supplies the data; the automation is yours.
Built for enterprise integration
The questions a procurement team asks first, answered up front.
- CAP-AU Validated
- CAP Atom feed validates against the CAP-AU Profile v3.0 (OASIS CAP 1.2).
- Official Government Feeds
- Built on official Australian government feeds, with the few community-decoded sources clearly flagged.
- Supply Nation Registered
- Registered supplier on the Supply Nation platform.
- Australian-Hosted Infrastructure
- All data stored and processed in AWS Sydney, on SOC 2 Type II infrastructure (Vercel and Supabase).
- Reliability
- Self-healing infrastructure and per-feed monitoring. See our SLA.
- Security
- API-key auth, row level security, rate limiting, and a published self-assessment.
Full compliance details at /compliance.
Start with a question about a place
The free tier covers 5,000 requests a month and never asks for a card. Everything on this page is one key and one request away.
Watching sites or assets? Asset monitoring. Larger or non-standard needs? Talk to us.
- vicVictoria Storms and FloodsFlood, Storm
- nswSouthern and Western NSW Severe Weather EventStorm
- vicCentral-East Victorian StormsFlood, Storm
- SA1.33 m · Below minorRiver Torrens at Holbrooks Road
- NSW1.55 m · Below minorJemalong Weir DS (Lachlan River)
- VIC0.31 m · Below minorSkipton (Mount Emu Creek )